


A campaign report arrives as a table of numbers. Each one is a count of something that happened, or two counts divided, made at its own moment by its own rule. Before you judge a figure, it helps to know what was counted, when, and how many events stand behind it.
This guide takes the numbers in the order a result passes through them: what each one records, how the rates are worked out, why two tools disagree, when a number is ready to read and how to choose one sensible thing to check next. What a campaign produces depends on what it offers and to whom, so the guide promises no particular outcome.
Start with what the campaign was for
Every campaign exists to produce one action you can name: a newsletter sign-up, a guide download, an enquiry sent from a contact page. That action is the conversion. In the platforms’ own documentation, a conversion is the action you chose to measure the campaign by, so the tool counts whatever you set up as one (Google Ads Help, seen 16 November 2026).
Write that action down before you open the report, and read every other number in relation to it. Impressions and clicks matter because they lead towards the conversion, not because they are large.
The path every result follows
A result is a chain of counts. Each step records something narrower than the one before, so the numbers usually shrink as you move down the chain. The sources in this section were seen on 16 November 2026.

- Impressions. The ad or listing was shown. In organic search, a link generally counts when it is on the current page of results, even if nobody scrolled down to it (Search Console Help).
- Viewable impressions. The ad could be seen. The standard used across the industry, set by the Media Rating Council in 2015, asks for at least 50% of a display ad’s pixels in view for one continuous second, or for two continuous seconds of a video ad playing (MRC guideline, version 2.0).
- Clicks. Someone clicked the ad. Platforms remove the clicks they judge invalid before they report.
- Sessions. The analytics tool recorded a visit. In Google Analytics, a session ends by default after 30 minutes without activity (Analytics Help, sessions).
- Engaged sessions. The visit went beyond a quick look. In Google Analytics, it lasted longer than 10 seconds, had a key event, or had 2 or more page or screen views (Analytics Help, engagement).
- Conversions. The action you named was completed and recorded.
- The conversion as assigned to a touchpoint. The tool decided which earlier interaction, such as one ad click, the conversion belongs to.
The main numbers and how each one is calculated
Most rates in a report divide one count by another. Google Ads Help and Microsoft Learn’s reference for Microsoft Advertising reports give matching formulas (both seen 16 November 2026), with small differences in what a rate is divided by, so they hold across tools even when the column names differ.
| Number | Calculation | It shows | It cannot show |
|---|---|---|---|
| Clickthrough rate (CTR) | Clicks ÷ impressions | How often a showing led to a click | What happened after the click |
| Average cost per click | Cost ÷ clicks | The average cost of a click | Whether the clicks led anywhere |
| Cost per thousand impressions | Cost ÷ impressions × 1,000 | The cost of a thousand showings | Whether anyone looked |
| Engagement rate | Engaged sessions ÷ sessions | How many visits went beyond a quick look | Whether those visits converted |
| Conversion rate | Conversions ÷ clicks (in Google Ads, ÷ ad interactions that can be tracked to a conversion) | How often a click led to the action | Why the other clicks did not |
| Cost per conversion | Cost ÷ conversions | The average cost of a recorded action | Which touchpoint brought it about |
Here is the arithmetic on an invented campaign. A ceramics studio advertises its newsletter for four weeks and counts sign-ups. It records 40,000 impressions, 1,200 clicks, 1,080 sessions, 594 engaged sessions and 36 sign-ups, at a cost of 540 currency units. These numbers are made up to show the arithmetic, not what to expect from a campaign of your own.
| Rate | Arithmetic | Result |
|---|---|---|
| CTR | 1,200 ÷ 40,000 | 3.0% |
| Average cost per click | 540 ÷ 1,200 | 0.45 currency units |
| Cost per thousand impressions | 540 ÷ 40,000 × 1,000 | 13.50 currency units |
| Engagement rate | 594 ÷ 1,080 | 55% |
| Conversion rate | 36 ÷ 1,200 | 3.0% |
| Cost per conversion | 540 ÷ 36 | 15 currency units |
None of these results is good or poor on its own, as the platform’s help page on clickthrough rate points out:
"…a good CTR is relative to what you’re advertising and on which networks"
Google Ads Help, "Clickthrough rate (CTR): Definition", seen 16 November 2026
This guide therefore gives no target figures. The useful comparison is with an equal earlier period of your own campaign.
Why two reports rarely agree
An ad platform and an analytics tool can describe the same campaign with different numbers, and often both are correct. The pages linked here were seen on 16 November 2026.
- Different events
- The ad platform counts clicks; the analytics tool counts sessions. Two clicks within 30 minutes can be one session, a visitor can leave before the analytics tag runs, and a redirect can drop the campaign parameters (Google Ads Help, clicks and sessions).
- Different names
- The same action can be a conversion in Google Ads and a key event in Google Analytics, counted by each tool under its own settings.
- Different assignment
- An attribution model is the rule that assigns a conversion to one or more earlier touchpoints. Last click assigns all of it to the last ad clicked; a data-driven model shares it out using the account’s past data. At the time of writing, Google Ads offers these two models and Google Analytics three.
- Different counting rules
- An impression is counted by a different rule in organic search, paid search and display. An email open is weaker still: Mailchimp Help’s page “About Open and Click Rates” (seen 16 November 2026) explains that an open is recorded when a small image in the email loads, so mail apps that load images automatically can inflate the count.
When two numbers differ, find which of these explains the gap before you decide that one of them is wrong.
When a number is ready to read
Counts arrive at different speeds, and some change after they first appear. The documentation for Google Ads and Google Analytics gives one example, seen on 16 November 2026; other platforms publish their own timings.
Google Ads aims to show clicks, impressions and cost within about an hour, while conversions take longer (data freshness). Reach, the number of different people shown an ad, and frequency, how often each of them saw it, are estimates that can take up to 3 days to appear (reach and frequency). Google Analytics Help states: "Data processing can take 24-48 hours. During that time, data in your reports may change." It adds that the touchpoint a key event is assigned to can change for up to 12 days after the event is recorded (Analytics data freshness). Conversions keep arriving while the conversion window is open: 30 days by default in Google Ads, and up to 90 days for some conversion sources.
So leave the most recent days out of any judgement, and treat recent conversion counts as provisional until their window has closed.
How much a small number can tell you
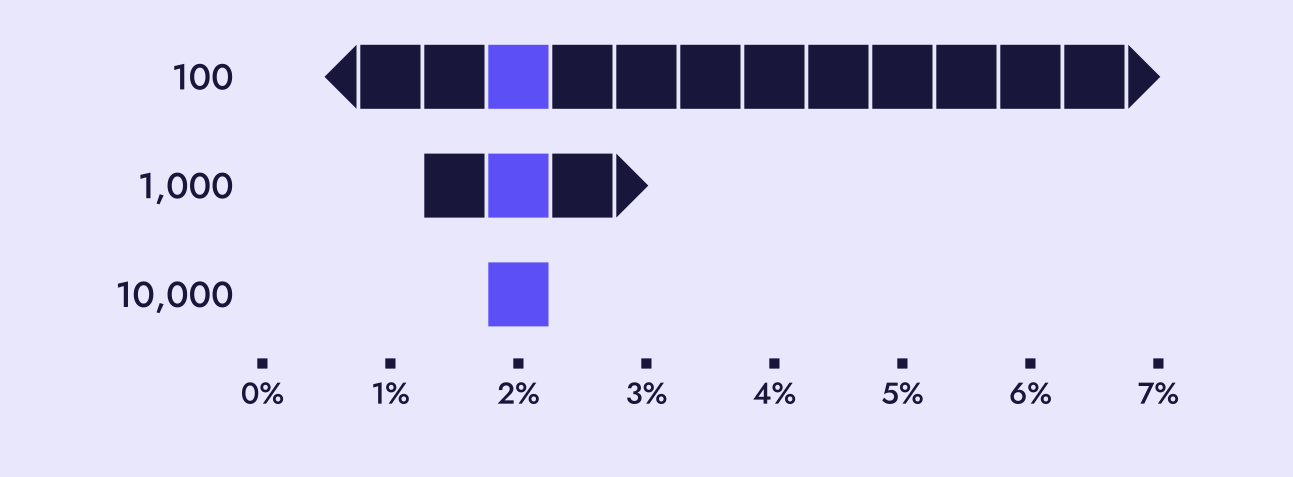
A rate built from a few events can move a long way by chance. The chart shows the range of rates a set of counts is consistent with, using the Wilson interval for a proportion at the 95% level, as given in the NIST/SEMATECH e-Handbook of Statistical Methods. The counts are invented to show the arithmetic.
| Clicks | Conversions | Rate | Plausible range |
|---|---|---|---|
| 100 | 2 | 2.0% | 0.6% to 7.0% |
| 1,000 | 20 | 2.0% | 1.3% to 3.1% |
| 10,000 | 200 | 2.0% | 1.7% to 2.3% |
The worked example’s 36 sign-ups from 1,200 clicks give about 2.2% to 4.1% around its 3.0%. The range is where the rate would plausibly settle with far more clicks; it does not predict next week.
Three habits follow. Compare a period with an equal earlier period of your own, not with a figure from elsewhere. Split a total by time, device or network before you judge it, because a change in one part can hide inside an unchanged total. When a tool marks a test result as statistically significant, read it as the tool means it: Google Ads Help explains that the difference is unlikely to be due to chance, and suggests 2 to 3 weeks of data (experiments, seen 16 November 2026). It is not a promise about the next period.
What to do next: find where the path first narrows
Read the chain from the top and compare each step with the same step in your own earlier period. Stop at the first step that falls short. Every step below it starts from that smaller number, so it is the most sensible place to look.
| First step that falls short | What to check | Where it shows |
|---|---|---|
| 1. Impressions | Whether the ads are running and eligible, their schedule, and the size of the audience or of search demand | Campaign status; impression share |
| 2. Viewable impressions | Where display and video ads appear on the page, and on which placements | Viewable rate |
| 3. Clicks | Whether the message matches what that audience was looking for, split by device and network | CTR by segment |
| 4. Sessions | Whether the landing page loads, carries the analytics tag and keeps its campaign parameters through redirects | Clicks beside sessions |
| 5. Engaged sessions | Whether the page continues what the ad said, and how quickly | Engagement rate |
| 6. Conversions | Whether the last step is clear and short, and whether it is recorded at all: complete it once yourself | Conversions column |
| 7. Conversions that differ between tools | Each tool’s attribution model, conversion window and reporting date | Attribution settings |
Each reading then ends in one of three ways. If every step is in line with your earlier period, keep the campaign as it is. If the step that falls short is in the last few days, wait for the counts to settle. Otherwise, change one thing at that step.
A short routine for each reading
- Fix the date range, and leave out the days still being processed.
- Read the counts before the rates.
- Compare them with an equal earlier period of your own.
- Find the first step where the path narrows more than it did before.
- Write down the one change you make, with its date.
Questions that come up often
Can a conversion rate be above 100%?
Yes. Google Ads divides conversions by the ad interactions that can be tracked to a conversion, so when more than one conversion is counted for a single click, the rate can pass 100% (conversion rate, seen 16 November 2026).
Why did last week’s conversions rise after I had already read them?
The main conversion columns in Google Ads date a conversion by the click, not by the moment of the conversion (conversion tracking data, seen 16 November 2026). A sign-up today after a click last week is added to last week while the conversion window is open.
Is a high bounce rate a problem?
Not on its own. Bounce rate is the other side of engagement rate, the share of sessions that were not engaged. Whether that matters depends on what the page is for, since a page that answers one question can do its work in a short visit.
For who writes these guides and how their figures are cited, dated or labelled as illustrations, see About Enlinea and the editorial policy.